Introduction
TheSandbox class serves as a flexible development environment for testing and optimizing investment strategies. Its main purposes are:
- Experimentation & Prototyping: It allows users to rapidly test new strategies, feature configurations, and signal models in isolation from production systems.
- Hyperparameter Tuning: By integrating with optuna, it supports automated hyperparameter optimization, enabling efficient exploration of parameter spaces for better model performance.
- Signal Generation & Evaluation: It computes trading signals and evaluates them using customizable metrics, supporting both single-run and cross-validation workflows.
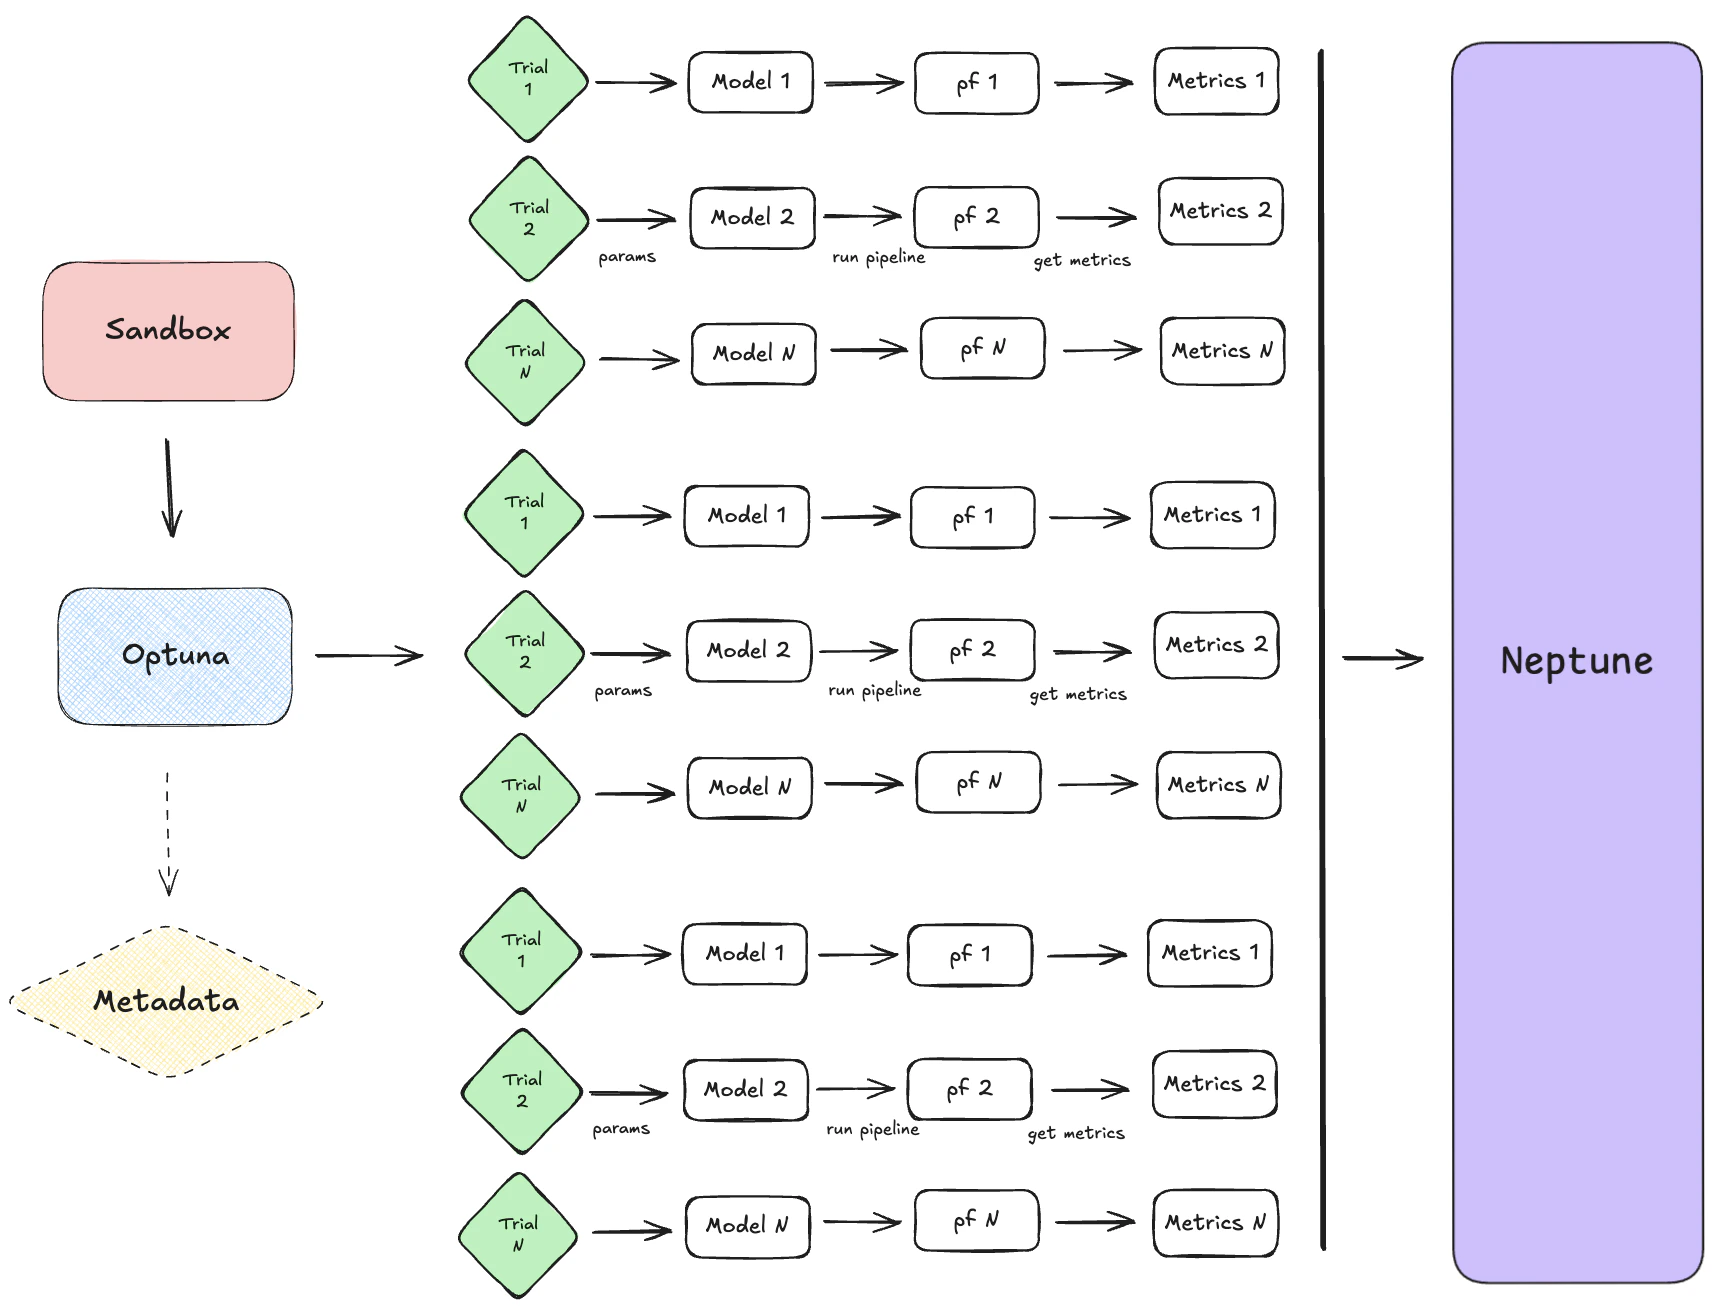
Sandbox explores the full workflow of the system:
- Data Loading: It manages the selection and filtering of feature/model configurations, which define how data is loaded and preprocessed.
- Model Execution: It runs models with various parameter sets, leveraging
optunafor systematic search and optimization. - Output Configuration: It supports flexible metric selection and output formatting, making it easy to compare results across experiments.
- Logging & Tracking: It integrates with trackers (e.g., Neptune) and uses structured logging to monitor experiments, making debugging and analysis straightforward.
Sandbox is designed to streamline the research and development cycle for systematic trading strategies, providing a controlled environment to explore, tune, and validate ideas before deployment.
Model Processes
TheSandbox integrates a variety of model classes—such as ArbitrageClipIndex, RollingOUProcess, and others—by using a registry of feature configurations. Each configuration specifies the model class, its parameters, signal definitions, and target metrics. This allows users to easily select and experiment with different strategies by referencing their configuration in the registry.
The modular approach means that:
- Each Model Encapsulates Its Own Logic: Parameters, signal models, and metrics are defined per model, ensuring that each strategy is self-contained and reusable.
- Consistent Pipeline Usage: Regardless of the model chosen, the Sandbox can run optimization, evaluation, and reporting in a uniform way, thanks to the standardized configuration structure.
- Easy Extensibility: New models or strategies can be added by simply creating a new configuration entry, without modifying the core workflow logic.
Pipeline Execution
Data is pulled using vectorbtpro’sData objects, using load_clean_data by default. This function fetches and updates historical market data for the specified symbols and timeframes, ensuring the latest information is available for modeling.
Once the data is loaded, it is passed into the OptunaTuner class. This class executes the strategy logic, applying the model’s parameters and signal definitions to generate trading signals and portfolio analytics. OptunaTuner is responsible for automating the exploration of hyperparameters during strategy optimization. It leverages the optuna framework to systematically search for the best parameter combinations that maximize (or minimize) specified performance metrics.
Signals—such as long/short entries and exits—are generated within the pipeline by applying the model’s signal logic to the input data. Each model configuration specifies a signal_model (e.g., “twin_spread” or “crossover1d”) along with threshold parameters for entries and exits.
During execution, the pipeline uses these parameters to transform raw data into actionable trading signals. The parameter search systematically explores different combinations of these thresholds and logic settings, optimizing for the best-performing signal generation rules.
Key aspects include:
- Automated Search:
OptunaTunerruns multiple trials, each with different hyperparameter values, to efficiently explore the parameter space. - Sampler/Pruner: By default, the
Sandboxuses theTPESampler(Tree-structured Parzen Estimator) for intelligent sampling and a pruner such asSuccessiveHalvingPrunerto stop unpromising trials early, saving computation time. - Configuration: The
Sandboxallows users to set the number of trials (n_trials), control parallelization (n_jobs), and enable memory checks (gc_after_trial) to manage resource usage during optimization, among other tools. - Integration: All these options are passed to
OptunaTuner, which manages the study lifecycle, trial execution, and result collection, making hyperparameter tuning seamless and reproducible. - Cross-Validation: The system supports cross-validation (when
cross_validate=True), allowing strategies to be evaluated on multiple data splits for robust performance assessment. The pipeline can apply various transformations, such as rolling windows or expanding windows, to compute features or signals dynamically over time. This approach ensures that strategies are tested under realistic, diverse conditions, supporting reliable research and development. - Multi-Asset Processing: Data objects can be tuned using multiple pair of symbols, enabling simultaneous processing and evaluation of strategies across several assets.
- Performance Metrics & Metric Registry: Single or multiple quantitative measures such as Sharpe ratio, Sortino ratio, and annualized return, which assess the effectiveness of a strategy, are structured around a “metric registry”. First, metrics are specified as a list or dictionary (e.g., metrics=[“sharpe_ratio”, “sortino_ratio”]) in the Sandbox class. During pipeline execution, each metric is computed using the relevant method or function, often leveraging vectorbtpro’s built-in analytics or custom metric functions. If cross-validation or rolling windows are used, metrics are aggregated across splits or windows using a reduce function (e.g.,
np.nanmedian). Then, The computed metrics are used as objectives for hyperparameter optimization (e.g., maximizing Sharpe ratio), guiding the search process inoptuna. - Structured Formats: The Sandbox class returns a
FeatureOutputnamedtuple, which contains both theoptunastudy object and a dictionary of computed metrics. This approach ensures that all relevant outputs—optimization results, performance statistics, and signal data—are easily accessible for further analysis or reporting.
Orchestration
The Sandbox, trackers, analyzers, and composers work together to form a cohesive workflow for strategy optimization and analysis:- Sandbox: The Sandbox sets up the study by managing feature configurations, running optimization trials, and computing metrics. It acts as the central hub for experimentation and hyperparameter tuning.
- Trackers (e.g., Neptune): Trackers like
NeptuneTrackerrecord intermediate and final results during optimization. They log trial data, metrics, and (optionally) visualizations, enabling detailed monitoring and reproducibility of experiments. - Analyzers and Composers: Analyzers like
NeptuneAnalyzerfetch and process logged data to generate advanced views, such as Pareto fronts, parameter importance plots, and optimization histories. Composers likePortfolioComposer,SignalComposerorColumnStackComposeruse the best trial(s) parameters to simulate and analyze a portfolio or multuple aggregated portfolios performance.
Configuration Management
FeatureConfig objects serve as structured containers for storing model and parameter sets.
Each FeatureConfig defines:
- Model Class: Specifies the trading strategy or feature model (e.g.,
ArbitrageClipIndex,RollingOUProcess). - Parameters: Includes signal thresholds (e.g., long_entries, short_exits) and model-specific configurations (e.g., training_window, splitter).
- Metadata: Attributes like
study_name,timeframe, andidhelp identify and organize configurations.
FEATURE_MODEL_REGISTRY, enabling modular experimentation and consistent usage across pipelines.
Trial Monitoring
TheNeptuneTracker is designed to log trial parameters and metrics during optuna optimization. It integrates seamlessly with Neptune to provide real-time tracking and post-experiment analysis.
Key Features:
- Live Streaming: When
live_stream=True,NeptuneTrackeruses theNeptuneCallbackto log trial parameters, metrics, and visualizations during optimization. Intermediate results, such as trial distributions and optimization history, are logged at specified intervals. - Post-Experiment Logging: If
live_stream=False, the tracker logs all trial data and visualizations after the study is completed usinglog_study_metadata. - Trial Parameters: Each trial’s hyperparameters are logged under the
study/distributionsnamespace. - Metrics: Performance metrics like Sharpe ratio or Sortino ratio are logged under
best/valuesandtrials/trials. - Visualizations:
optunavisualizations (e.g., Pareto fronts, parameter importance) are (optionally) logged using theNeptuneCallback.
Advanced Experiment Analysis
TheNeptuneAnalyzer provides tools for analyzing and visualizing experiment data logged by NeptuneTracker. It enables detailed insights into optimization results and trial performance.
- Best-Trial Selection: Fetches the best trials based on metrics using
get_best_trials. Allows users to identify optimal parameter sets for further analysis. - Hypervolume Analysis: Computes and visualizes the hypervolume history for multi-objective studies using
plot_hypervolume_history. Helps assess the trade-offs between competing objectives. - Score Distributions: Generates histograms and correlation matrices for metrics and parameters using
plot_metrics_correlationandplot_params_correlation. Provides insights into parameter sensitivity and metric relationships. - And More…
NeptuneAnalyzer complements the NeptuneTracker by enabling advanced post-experiment analysis, making it easier to refine strategies and optimize future experiments.